3 The Main Data Table
Each row in the main data table represents a putative p53 motif in the hg38 reference assembly of the human genome. The first column contains the genomic coordinate (‘unique_id’), and other categorical and quantitative data describing the fundamental characteristics of the p53 motif can be found in other columns. Figure 3.1 shows the 7 main navigation features for the Main Data Table, each of which will be discussed in the following sections.
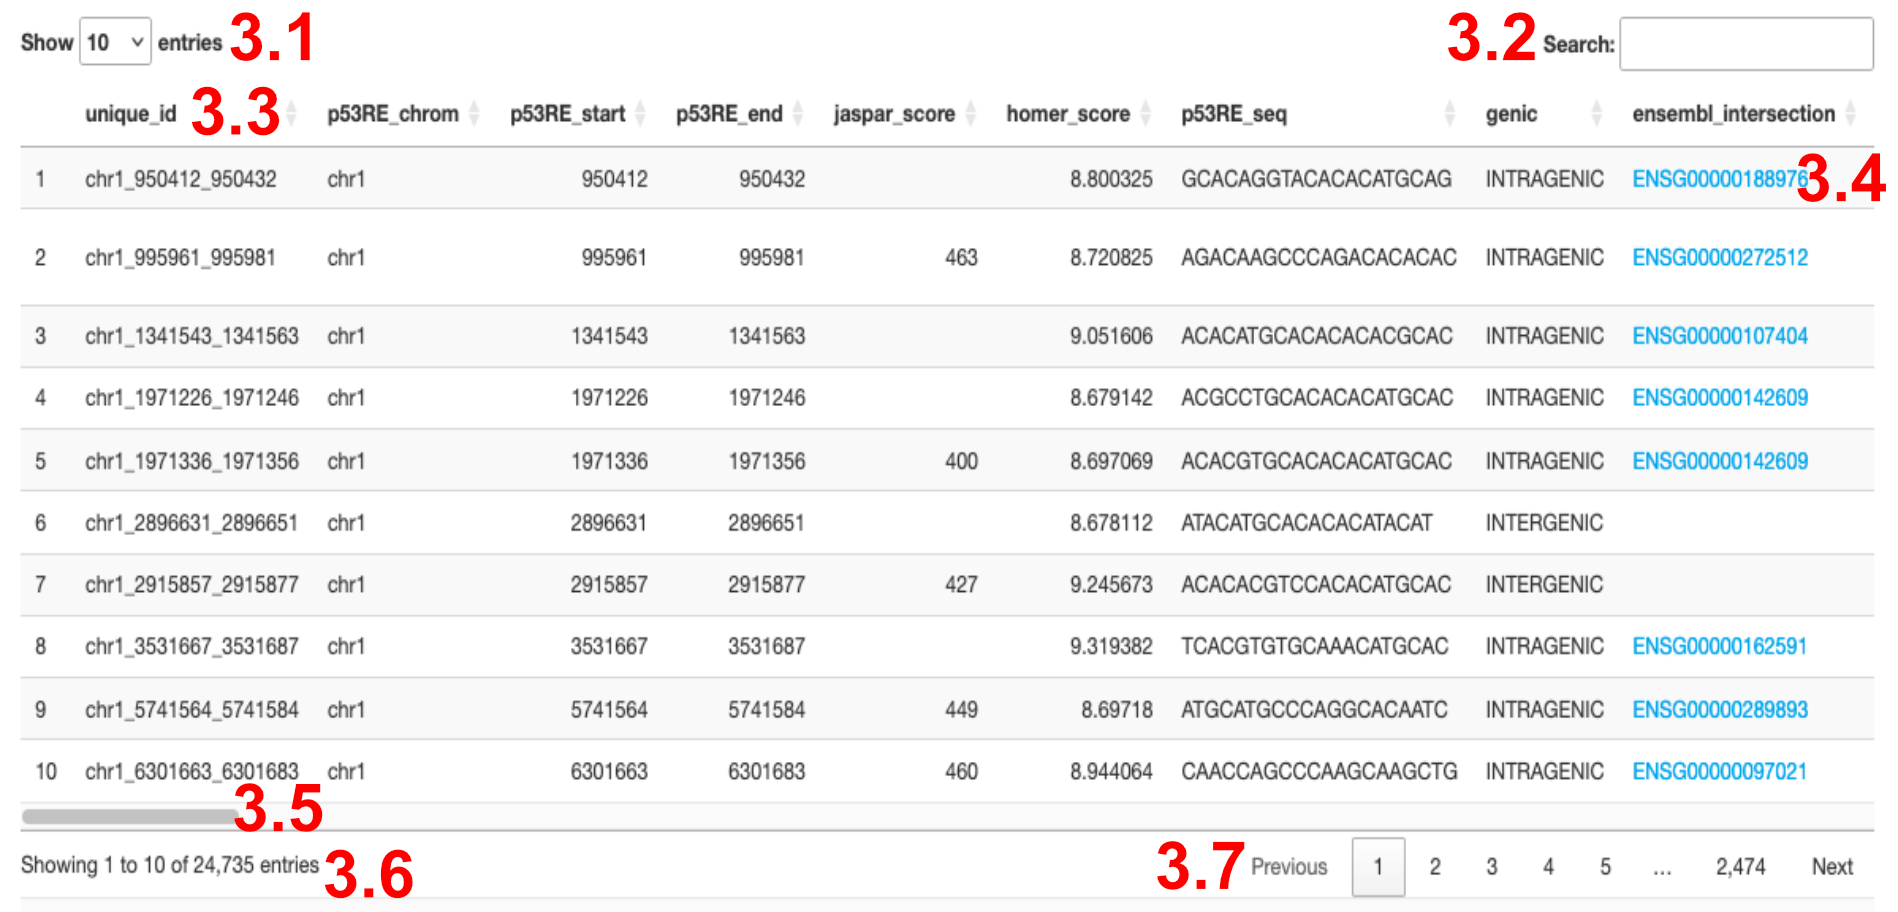
Figure 3.1: Navigating the Main Data Table
3.1 Changing the number of displayed rows.
Users can select the number of rows they would like displayed on screen. By default, 10 rows are displayed, but users can select 25, 50, or 100 rows.
3.2 Filter table by search term.
Users can enter text to filter rows that are displayed based on terms found anywhere within the table. Text search is case-insensitive and partial strings are matched. The number of rows that contain your search term are displayed in the bottom left corner of the Data Table, as shown in 3.4
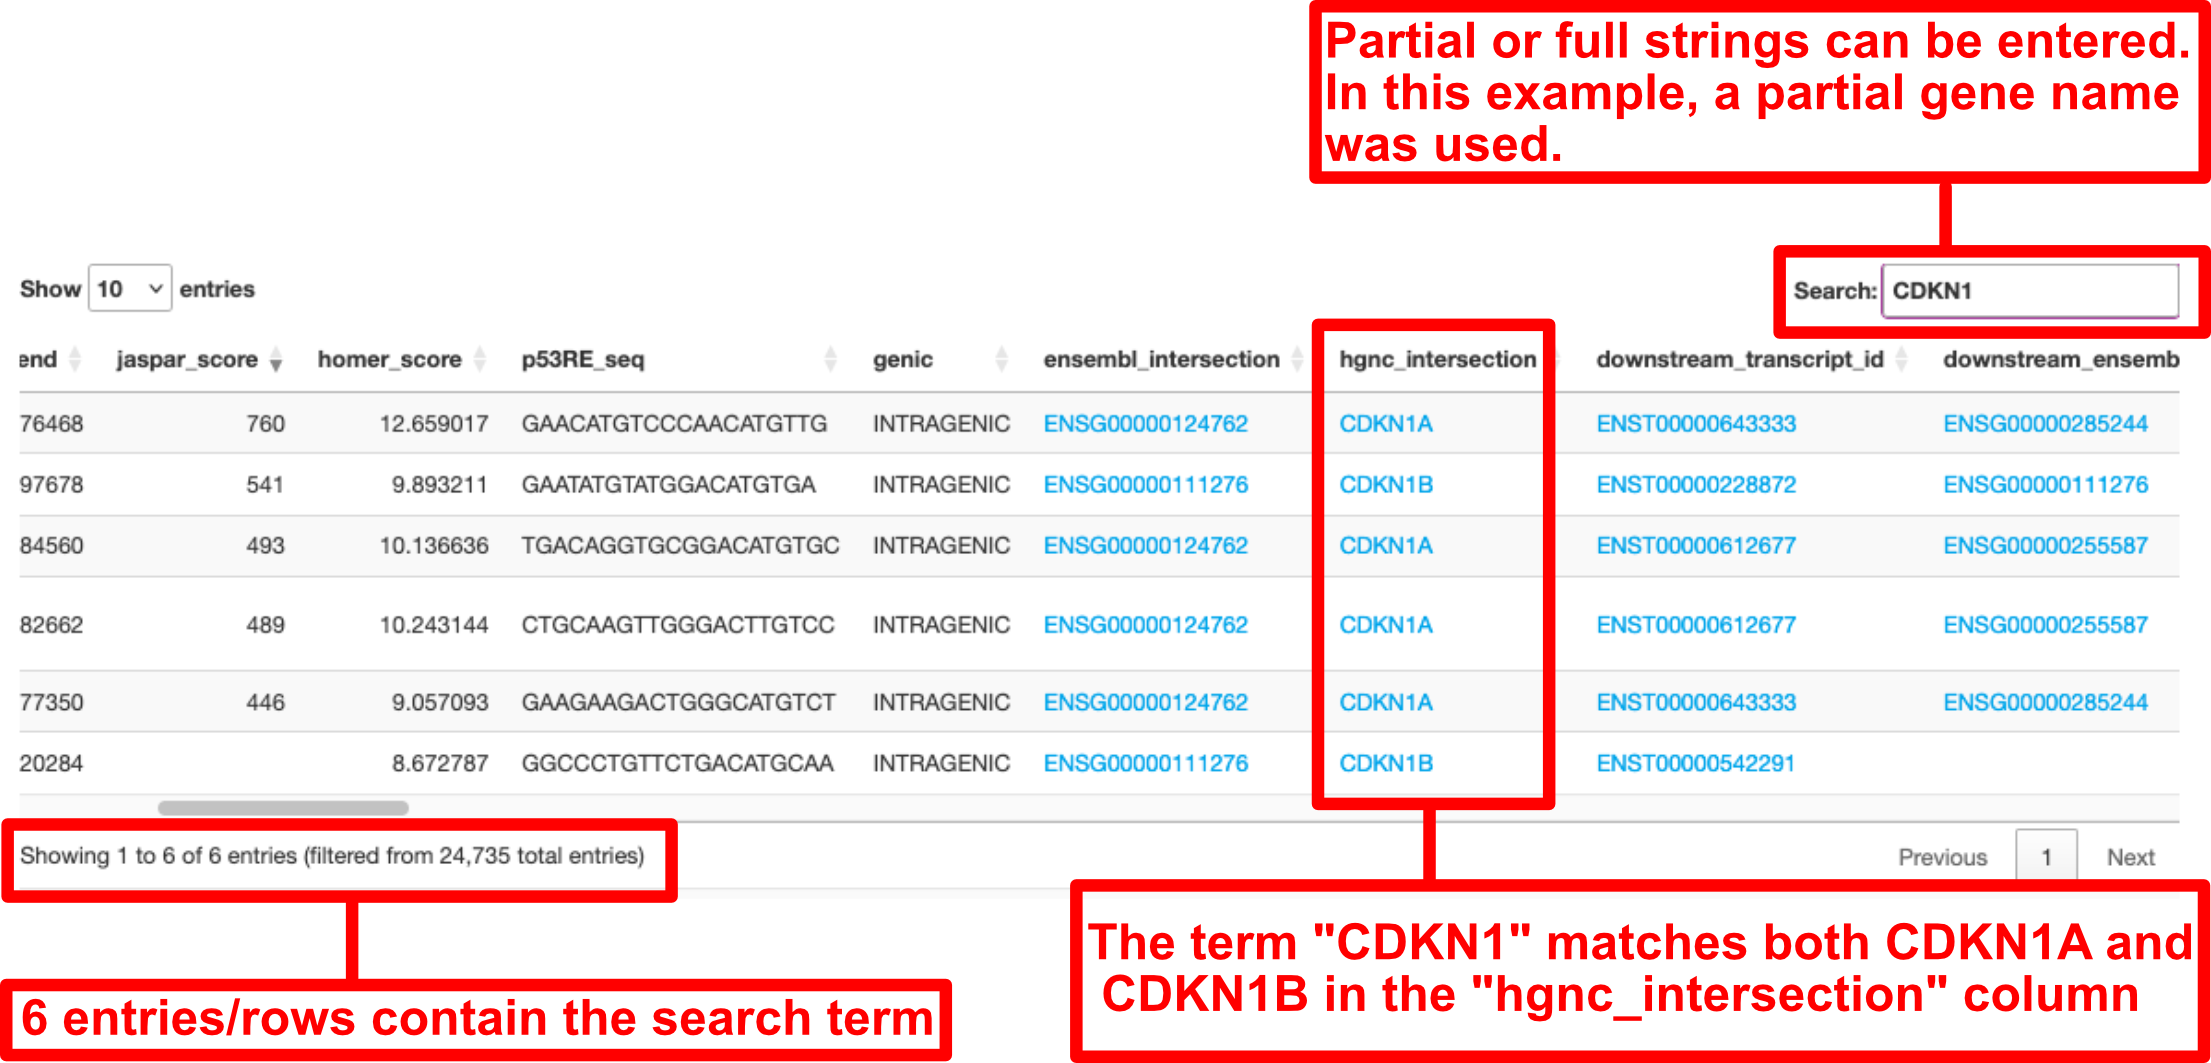
Figure 3.2: Using the Search box in the Main Data Table
3.3 Column sorting
Columns can be sorted in a descending or ascending fashion by clicking/selecting the grey arrow icons next the name of each column. The shading of the up and down arrows denote whether a column is currently unsorted, sorted in ascending fashion, or in a descending fashion. Categorical data columns can be sorted alphabetically from A-Z.
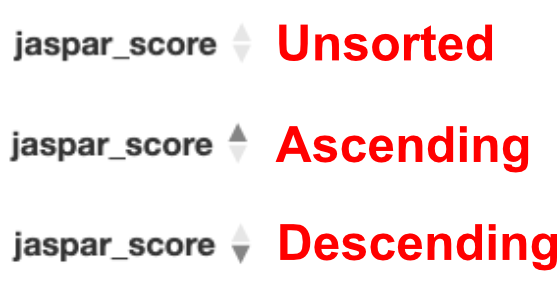
Figure 3.3: Using and interpreting the sorting arrows
3.4 Hyperlinks
Some values within the data table exist as hyperlinks, which will take users to specific external data sources (such as the ENSEMBL or UCSC databases for genes/transcripts).
3.5 Horizontal Scrolling
Not all data can be displayed on the screen at one time, so a horizontal scroll bar allows users to visualize other columns. The number of columns displayed at one time is ultimately determined by the resolution of the users screen and the current zoom level in their web browser.
3.6 Row Display Characteristics
The number of rows/p53 motifs currently being displayed and the total number of rows using the current filtering methods (based on Basic Filtering) can be found in the lower left corner of the data table as shown in Figure 3.1. Basic Filtering Methods will be discussed in Chapter 4. An example of how this information is displayed can be found in Figure 3.4.
When the Search Box is used, the display changes to show the number of rows being displayed out of the total number of rows that match your Search Term (Figure 3.4B). The Total number of rows/entries that meet your Basic Filtering criteria are also shown.
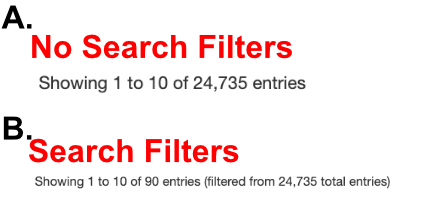
Figure 3.4: How to interpret the Row Display when using the Search Box