4 Filtering
The p53motifDB contains information on over 410,000 putative p53 motifs (rows) each containing over 40 categorical features or quantitative statistics (in columns).
Users may want to perform exploratory data analysis to generate novel hypotheses or they may have a specific question they’d like to answer, such as whether there is a p53 binding event near their favorite gene. Both of these scenarios can investigated using a series of Data Filters found on the left-hand side of the website/app. These Data Filters are designed to be intuitive and easy to use, but are purposefully not comprehensive. Not all data types (columns) can be filtered using the provided tools. We tried to make the filtering tools intuitive so that all users could jump in quickly and start to explore the dataset. To faciliate this, we chose not to include advanced data filters or filters for all of the categorical and quantitative information in the data table.
We strongly recommend using the provided filters for simple filtering operations and for intial hypothesis generation. Advanced filtering and analysis can be performed on the exported datasets (see Chapters 5 and 6). To facilitate this, the entire Main Data Table and all accessory data tables can be downloaded from Zenodo for input into any data analysis platform (such as R). Users who are familiar with traditional database queries can also find a pre-compiled sqlite database at Zenodo.
In the following sections, we will walkthrough the 5 categories of data filters, how to use them, and our recommendations for filtering.
4.1 Basic Filters
First, let’s discuss 4 basic data filters for position of the p53RE within the genome and its location relative to genes.
4.1.1 Gene Symbol/HGNC Filtering
The top box (shown in Figure 4.1A allows users to input a Gene Symbol (HUGO Gene Nomenclature Committee ID) and filter the Data Table based on whether a p53motif (row) contains that gene information. The input is case-insensitive. For example, typing in “CDKN1A” and “cdkn1a” will yield the same set of filtered data (5 rows)(shown in the dashed box of Figure 4.1A. Partial strings are also matched, so typing “CDKN1” will bring up results containing CDKN1A, CDKN1B, and CDKN1C.
The HGNC Filter in the left panel (Figure 4.1A ) and the Search Box in the upper-right hand side of the Main Data Table Window (shown in Figure 4.1B ) can both be used to search for HGNC/Gene Symbol information, but there are key differences between the two filtering approaches. They are not identical. Most important is that the HGNC-specific filter is run first and will reduce the number of rows displayed in the Main Data table in combination with all other Data filters (described in subsequent sections). The Search box would then filter any results in the Main Data table further.
As an example, we will discuss the behavior of the HGNC filter and the Main Data Table Search feature if the search terms CDKN1A and PANDAR are used in Figures Figure @ref{fig:hgncsearch}A and B . These are both known p53 target genes with nearby p53RE, so users may want to filter their data to find p53RE near both CDKN1A and PANDAR. Typing CDKN1A into either the HGNC Filter box or the Search box will yield the same number of results (5 rows from the original 412,586, assuming no other filters are used). When the HGNC Filter is used to search for CDKN1A, the Row Display in the Main Data Table will say “Showing 1 to 5 of 5 entries” (Figure 4.1A, dashed box). If the Search Box is used, the display will depict “Showing 1 to 5 of 5 entries (filtered from 412,586 total entries)”. This tells users that there are 412,586 rows that match the filters selected using the Data Filter panel (left-hand side), and that the term input into the Search Box has filtered the dataset to just 5 rows (Figure 4.1 B, dashed box).
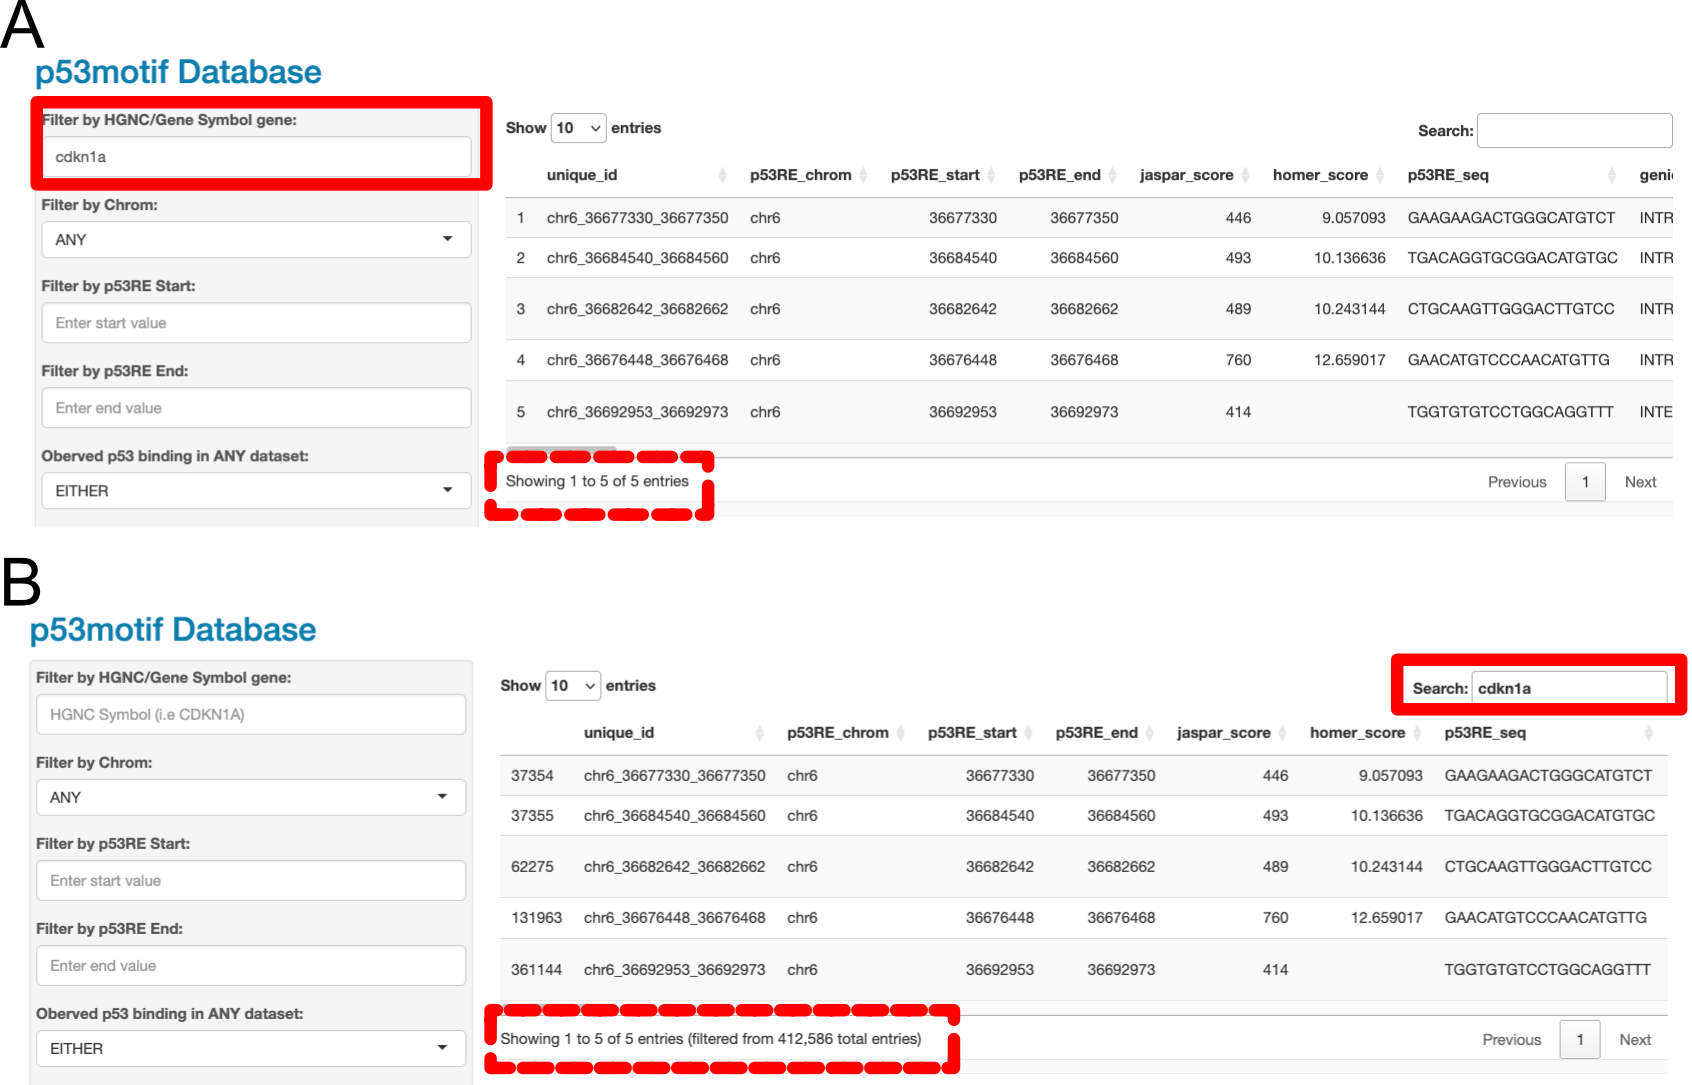
Figure 4.1: Data Filters versus the Search Box
If we input CDKN1A into the HGNC Filter and then further refine our query using the Search Box for “PANDAR”, we see that there are two rows that match these criteria out of 5 total entries. The 5 entries are based on the number of rows that contain “CDKN1A”, and of those 5 rows, 2 contain the term “PANDAR” (as shown in Figure 4.2 A, dashed box). If we reverse the search terms, and place “PANDAR” in the HGNC Filter and “CDKN1A” in the Search Box, we receive the same two rows, but we now see this is the result of filtering based on only 4 entries (as shown in Figure 4.2B, dashed box). This is because there are 4 total rows in the entire dataset that contain the term “PANDAR”, of which 2 rows also contain the term “CDKN1A”. Understanding these seemingly small differences in filtering methods will help end users better understand how to use the data filtering tools to best refine their hypotheses.
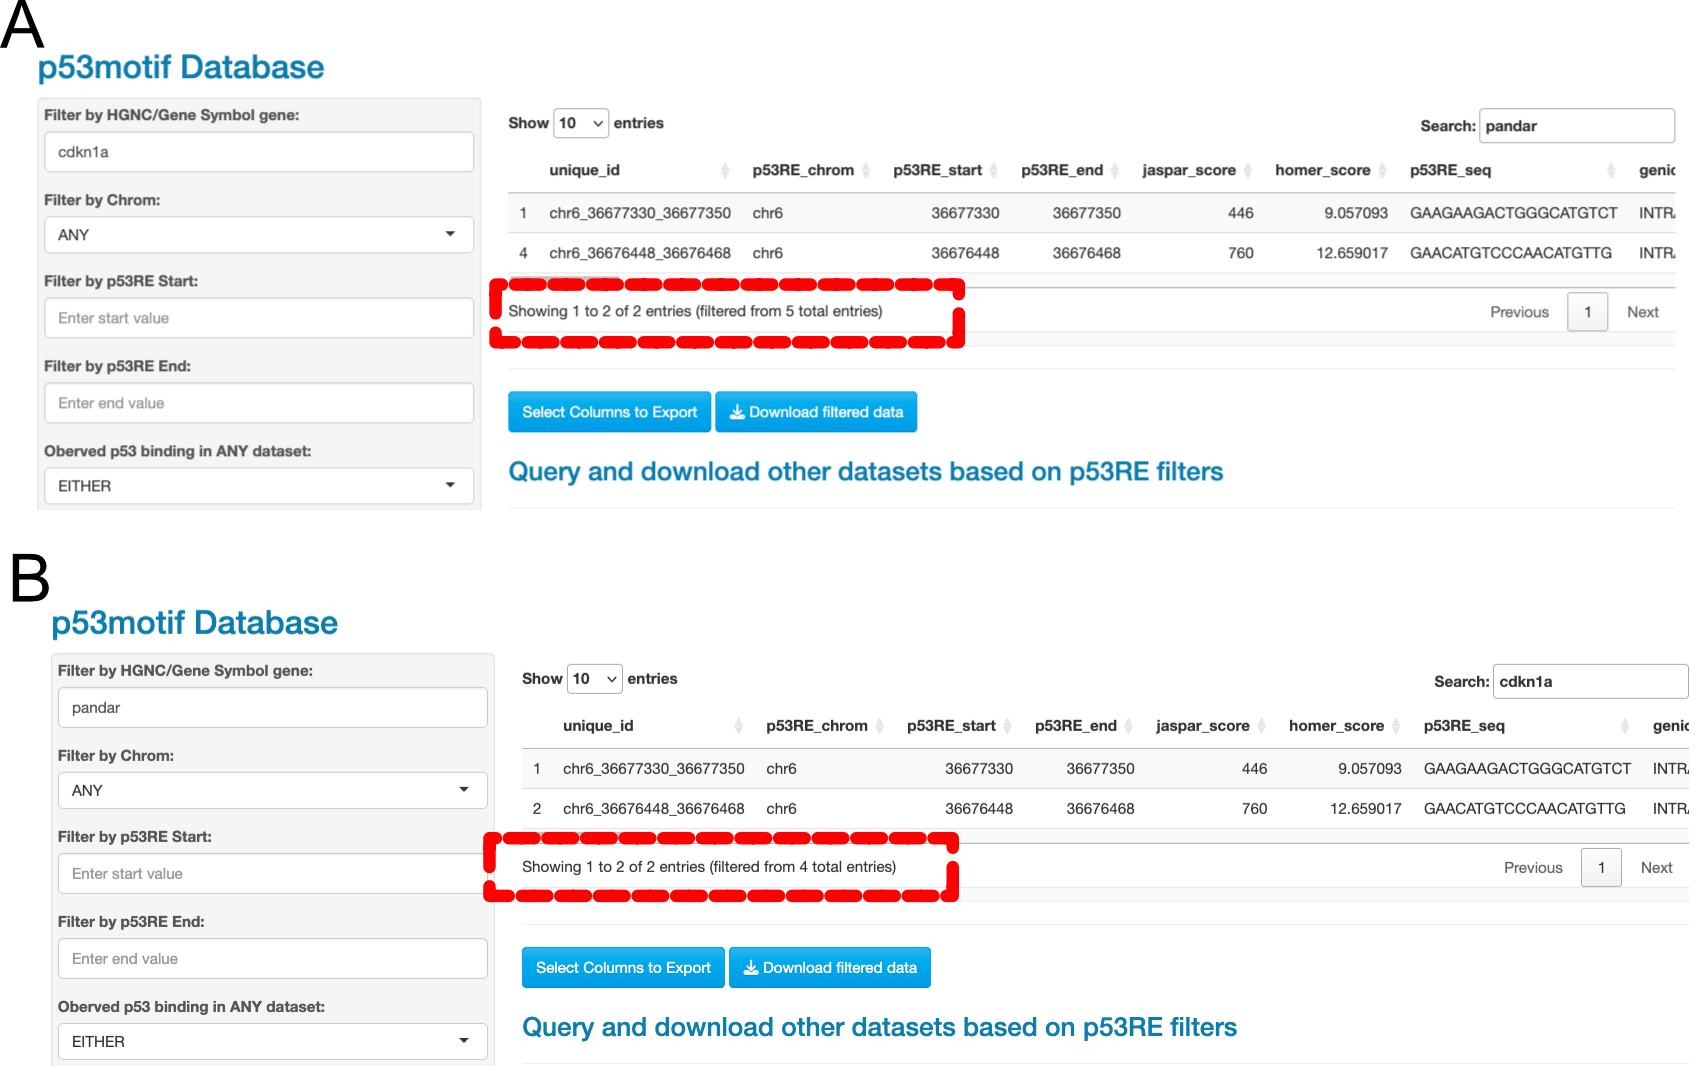
Figure 4.2: Data Filters versus the Search Box, Example 2
Another key difference between the HGNC Filter and the Search Box is the speed of filtering based on computational efficiency. Filtering via the HGNC filter box (on the left panel) is considerably quicker, so this should be the first choice for faster querying.
Gene symbol information is found in three columns of the Main Data table (hgnc_intersection, downstream_hgnc, upstream_hgnc). It is important to understand how these columns differ from each other. The “hgnc_intersection” column denotes whether the p53motif location falls within an HGNC-named gene (Figure 4.3 A). The upstream_hgnc and downstream_hgnc columns denote the nearest upstream (5’) or downstream (3’) transcriptional start site (TSS) of an HGNC-named gene. For example, the p53 motif location depicted in Figure 4.3A would yield Gene X as the upstream_hgnc result and Gene Y as the downstream_hgnc result. Figure 4.3 C shows a more complicated example. In this case, Gene Y would be the result in both the hgnc_intersection and upstream_hgnc columns, since the TSS of Gene Y is the closest TSS to this p53RE. On the contrary, Gene X would be found in the upstream_gene column and Gene Y would be the downstream_hgnc result for the p53RE, as depicted in Figure 4.3D.
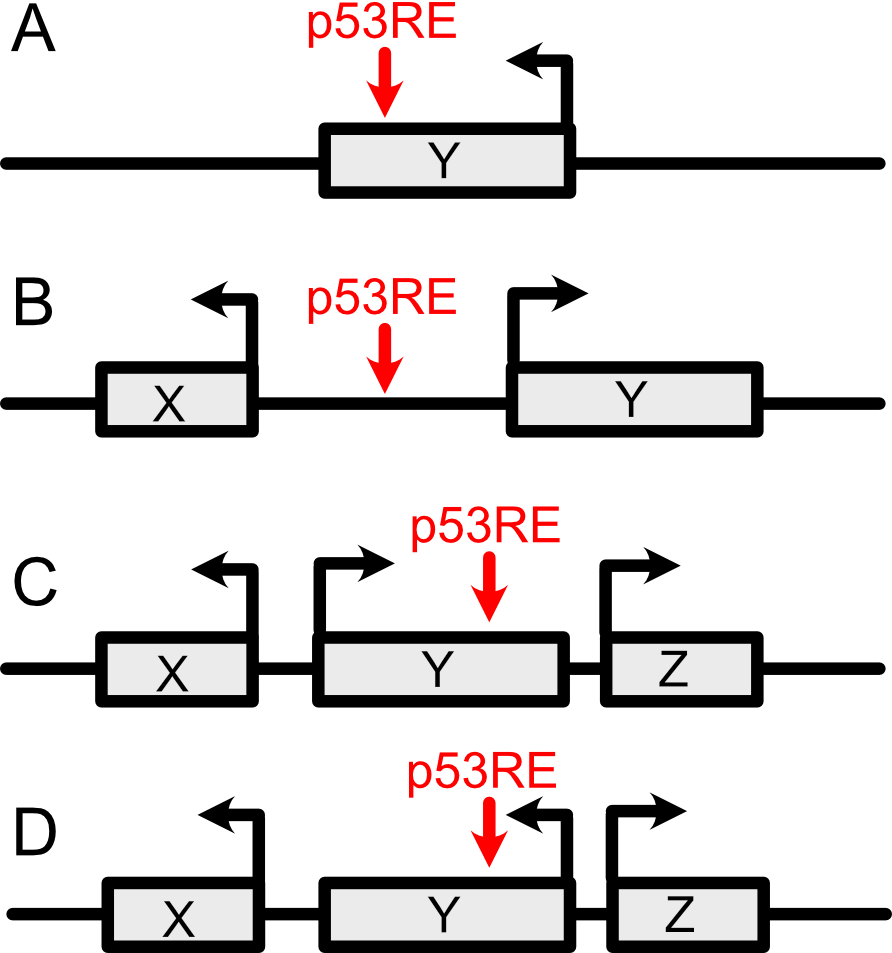
Figure 4.3: How to interpret distance of a p53RE to the nearest HGNC Gene Location
4.1.2 Genomic coordinate filtering by chromosome and location
The next three filters allow users to filter p53RE (rows) by chromosome and position. Users can restrict the data displayed to a single chromosome using the dropdown box. Chromosomes are listed in numerical order (from 1-22) and then by chrX, Y, and M. Users can also filter p53RE by their position on a chromosome using the Chromosome Start and Chromosome Stop input boxes. Entering a number in the Chromosome Start box will filter rows where the p53RE is found 3’ (higher number) of the value input. Entering a number in the Chromosome Stop box will restrict the data to p53RE that are found 5’ (lower number) to the input value. For example, selecting chr19 and restricting the Chromosome Start and Stop to 500000 and 550000, respectively, (solid box, Figure 4.4) will find 6 entries (dashed box, Figure 4.4). This functionality is similar to using common genome browsers (like UCSC) and restricting the “view” to chr19:500000-550000.
Note that any numbers input into the Chromosome Start or Chromosome Stop boxes must be free of any commas or other delimiters.
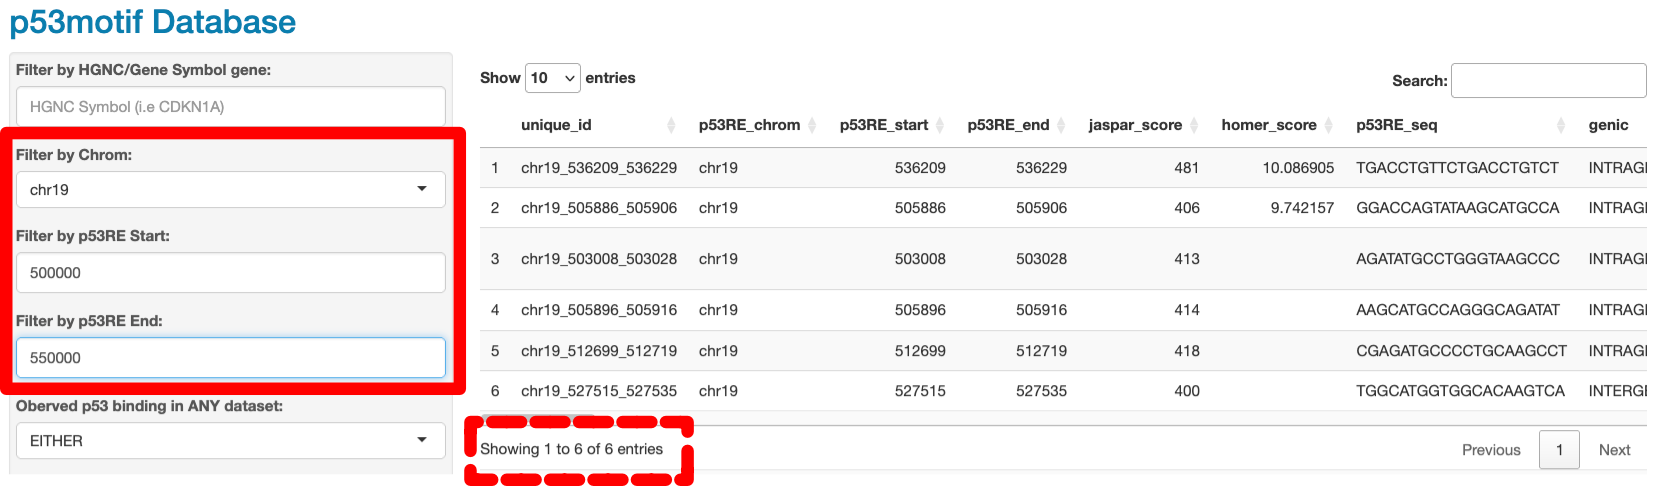
Figure 4.4: Filtering p53RE by chromosome location and position
4.2 p53 Binding Filters
This filtering panel allows for users to select p53RE with observed, in vivo p53 occupancy defined in a series of 4 different meta-analyses.
[1] A. Verfaillie et al., “Multiplex enhancer-reporter assays uncover unsophisticated TP53 enhancer logic,” Genome Res., vol. 26, no. 7, pp. 882–895, Jul. 2016, doi: 10.1101/gr.204149.116.
[2] K. Riege, H. Kretzmer, A. Sahm, S. S. McDade, S. Hoffmann, and M. Fischer, “Dissecting the DNA binding landscape and gene regulatory network of p63 and p53.,” Elife, vol. 9, Dec. 2020, doi: 10.7554/eLife.63266.
[3] T.-A. T. Nguyen et al., “Revealing a human p53 universe,” Nucleic Acids Research, Aug. 2018, doi: 10.1093/nar/gky720.
[4] F. Hammal, P. de Langen, A. Bergon, F. Lopez, and B. Ballester, “ReMap 2022: a database of Human, Mouse, Drosophila and Arabidopsis regulatory regions from an integrative analysis of DNA-binding sequencing experiments,” Nucleic Acids Res, vol. 50, no. D1, pp. D316–D325, Jan. 2022, doi: 10.1093/nar/gkab996.
The first dropdown box allows users to filter based on whether the p53RE was bound by p53 in at least one of the 4 meta-analyses (Figure 4.5). This represents the least stringent p53 binding filter because it allows that the occupancy was observed in a single experiment. Selecting NO will display p53RE without p53 binding in these studies, while selecting ANY will display all p53RE (rows) that pass all other filters. When users first start the p53motifDB, the default filtering scheme is to only display p53RE (rows) that have at least one observation of p53 binding across the 4 meta-analyses.
The remaining 4 dropdown boxes limit the filtering to individual p53 binding meta-analyses. In-depth, specific information on the underlying meta-analyses data can best be found in the specific manuscripts listed above. Users can export some of this information from Riege et al and the ReMap 2022 analysis, including specific cell lines and conditions where p53 binding was observed. in the “Query Other Datasets” Chapter 6).
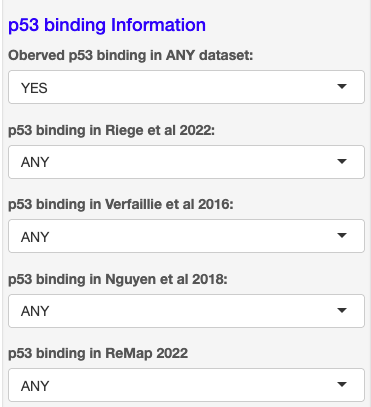
Figure 4.5: Filtering p53RE by p53 protein occupancy
4.3 Chromatin Filters
The second group of filters allows users to select p53RE that fall within genomic regions that have characteristics of putative transcriptional regulatory regions. The ENCODE Project identified genomic regions with defined chromatin structure characteristics. The goal was to segment the genome into functional regions, such as regions that are likely to be enhancers or promoters or regions that are likely to be heterochromatin. The p53motifBD surveyed p53RE locations relative to these chromatin-based functional genome segmentations. Below, we describe the three types of segmentation and how users can filter p53RE based on these characteristics.
4.3.1 Candidate cis-regulatory elements (cCRE)
The first filter allows users to select p53RE that overlap candidate Cis-Regulatory Elements (cCRE). These elements were defined by integrating DNase and ATAC accessibility information, H3K4me3 and H3K27ac enrichment, and binding by CTCF or other transcription factors.
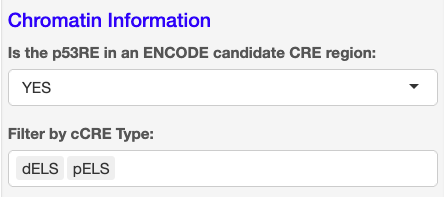
Figure 4.6: Filtering by candidate Cis-Regulatory Element (cCRE)
The top dropdown box (shown in Figure 4.6 allows users to filter by whether or not the p53RE is found within a defined cCRE (YES/NO) or can choose ANY to ignore cCRE as a discriminating factor. By default, the “ANY” filter is applied, meaning that cCRE is not used as a filtering criterion. The box below (“Filter by cCRE Type”) allows users to select specific types of cCRE and filter only on those by selecting terms (Described in Table 1) in the box below.
TABLE 1
| Abbreviation | Description |
|---|---|
| CA-CTCF | chromatin accessible and bound by CTCF |
| CA | chromatin accessible without other chromatin-based features |
| CA-H3K4me3 | chromatin accessible and enriched for H3K4me3 |
| CA-TF | chromatin accessible and bound by some transcription factors |
| dELS | distal enhancer-like signature |
| pELS | proximal enhancer-like signature |
| PLS | promoter-like signature |
| TF | bound by some transcription factors without other chromatin-based features |
More information on the process by which cCRE regions were defined, please see the SCREEN website from the Weng lab at UMass Med.
[1] J. E. Moore et al., “Expanded encyclopaedias of DNA elements in the human and mouse genomes,” Nature, vol. 583, no. 7818, pp. 699–710, Jul. 2020, doi: 10.1038/s41586-020-2493-4.
4.3.2 DNAse Hypersensitive Sites (DHS)
The second filter is for p53RE that are located within DNAse-Hypersensitive Sites (DHS) (box 3 in Figure 4.7). The ENCODE Project cataloged hundreds of thousands of regions of the genome, across hundreds of cells, tissues and conditions, that are accessible to DNAse and presumably would also be accessible to transcription factors, transcriptional machinery, and other DNA binding proteins (other than nucleosomes). Extensive analysis suggests these regions may be transcriptional regulatory elements, like enhancers, promoters, insulators, and silencers.
Users can filter p53RE based on the presence within DHS regions using the Basic Filters on the left panel (Figure 4.7), box 3), and can export additional information about these locations, including the cell type where the DHS was observed and cell type-specific scores, using methods described in Chapter 6: Querying Additional Datasets.
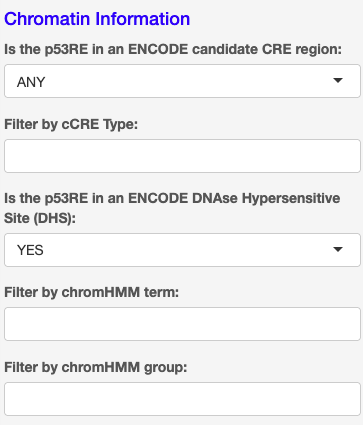
Figure 4.7: Filtering by chromHMM type
4.3.3 chromHMM
The final set of filters is for p53RE located within chromHMM-based genome segments. This is shown in the bottom two input boxes in Figure 4.7. chromHMM is a mathematical model that incorporates multiple forms of chromatin and transcriptional data to define the most likely “functional state” of that genomic location. For example, regions with high enrichment for H3K27ac, low levels of H3K4me3, and that are accessible to DNAse likely represent transcriptional enhancers. We incorporated the “fullstack” chromHMM dataset which defines genomic locations based on their most common functional classification across multiple cell types. Thus, users can select p53RE that are located in transcriptional enhancers, open chromatin regions, promoters, heterochromatin/transcriptionall repressed areas of the genome, and many other types of locations. To do this, users can select either detailed chromHMM terms or summary chromHMM groups from the respective dropdown menus shown in Figure 4.7.
A description of each annotation type can be found in the table below, but complete information on how each chromHMM can be found in [1], or at the Ernst Lab GitHub page.
TABLE 2
| Term | Long annotations | Group |
|---|---|---|
| Acet1 | H3K9me3 + class1 epigenome acetylations +simple repeats | acetylations |
| Acet2 | class1 epigenome acetylations weak; highest emissions in ES & iPSC. 19_DNase in ESC, iPSC and ES-deriv. Mixes of quescient in other cell types | acetylations |
| Acet3 | class1 epigenome acetylations very weak; universal quescient | acetylations |
| Acet4 | class 1 epigenome acetylations and IMR90 enhancers. 17_EnhW2 in most cell types | acetylations |
| Acet5 | class 1 epigenome acetylations and IMR90 enhancers weak. | acetylations |
| Acet6 | IMR90 class 1 acetylations. 18_EnhAc in Myostat, IMR90, Mesench | acetylations |
| Acet7 | Enhancers in IMR90, Myostat, Mesench, Epithelial, ENCODE2012 . IMR90 class 1 acetylations | acetylations |
| Acet8 | acetylations marks + enhancers in ESC-derived (H1_BMP4_Derived_Trophoblast_Cultu#FF0000_Cells) | acetylations |
| BivProm1 | bivalent promoter- more balanced H3K4me3/ H3K27me3 | bivalent promoters |
| BivProm2 | bivalent promoter- stronger on H3K27me3 | bivalent promoters |
| BivProm3 | 24_ReprPC in ENCODE, Blood & Tcell, Digestive, HSC &B-cell, Sm.Muscle. 23_PromBiv flanking in other cell types. H3K27me3 and H3K4me1 | bivalent promoters |
| BivProm4 | bivalent promoter in Blood & T-cells, HSC & B-cell, ESC. Prom_D2 in Brain, muscle, sm. Muscle, mesench, neurosph, myosate and adipose. A mix of Prom_D2, bivalent promoter and 22_prom_p in ESC_derived, ENCODE 2012, iPSC, Digestive, Epithelia, Heath and other cell types | bivalent promoters |
| DNase1 | DNase I only; CTCF in various cell types, Candidate Insulator | DNase |
| EnhA1 | enhancers in most cell types, weaker in blood. EnhA1 in Digestive, Other, ES_deriv, Epithelial, Heart, Muscle, Thymus and Neurosph | enhancers |
| EnhA10 | HSC&B-cell* enhancers (K4me1, K27ac, DNase) –not as strong as 64; weaker enhancers in other cell types | enhancers |
| EnhA11 | Monoctyes, neutrophils, HSC&Bcells * enhancers | enhancers |
| EnhA12 | Epithelial enhancers (H3K4me1 & DNase); ES_derived weaker acetylations + H3K4me1 | enhancers |
| EnhA13 | enhancers (H3K4me1) - epithelial, weak signals | enhancers |
| EnhA14 | Liver/Intestine/Digestive* enhancers (H3K4me1, H3K27ac, DNase); weak others | enhancers |
| EnhA15 | Liver/Intestine/Digestive enhancers weak | enhancers |
| EnhA16 | ENCODE cell line specific positions; H2A.Z, H3K4me1, H3K27ac, DNase | enhancers |
| EnhA17 | ESC, iPSC, Neurosph enhancers and some differentiated | enhancers |
| EnhA18 | ESC/iPSC enhancers (13_EnhA1) strong and some ESC-derived (ESC H3K4me1*); ERV1 repeats | enhancers |
| EnhA19 | ES/iPSC/ES-derived enhancers strong (H3K4me1, DNase, acetylations) | enhancers |
| EnhA2 | enhancers in mesenchymal, muscle, heart, neurosph, adipose. DNase in ESC and iPSC | enhancers |
| EnhA20 | HUVEC enhancers | enhancers |
| EnhA3 | strong enhancers in most cells, weaker in blood and ESC&iPSC | enhancers |
| EnhA4 | strong enhancers in myostat, mesench, lung, epithelial | enhancers |
| EnhA5 | enhancers in mesenchymal, myosat. DNase (weaker emission) in most other | enhancers |
| EnhA6 | Brain* enhancers (Brain_H3K4me1*, Brain_H3K4me3) | enhancers |
| EnhA7 | blood_enhancer* (Blood H3K4me1, H3K4me3). 13_EnhA1, 15_EnhAF in Blood&Tcell, HSC&B-cell. Mixed 24_ReprPC, 22_PromP, 17_EnhW2 in others. H3K4me1 &H3K27me3 weak. | enhancers |
| EnhA8 | active enhancers in blood* and thymus (H3K4me1, H3K27ac, H3K4me2, H3K4me3) | enhancers |
| EnhA9 | Blood* and thymus enhancer strongest. 9_TxReg and 10_TxReg5p in other ct | enhancers |
| EnhWk1 | weak enhancers acetylation in mesench & myostat. DNase in brain, IM90, Adipose, Epithelial, Neurosph, muscle | weak enhancers |
| EnhWk2 | Enhancers in muscle, adipose, heart, brain (13_ENhA, 15_EnhAF) (H3M4me1 and acetylations, weak). 18_EnhAc and 17_EnhW2 in other | weak enhancers |
| EnhWk3 | enhancers (H3K4me1, H3K27ac) in muscle, heart, adipose (weak emissions). Weak Enh, DNase signals in others | weak enhancers |
| EnhWk4 | weak enhancers (H3K4me1 weak, no H3K27ac) brain and neurosph | weak enhancers |
| EnhWk5 | weak enhancers blood* and thymus (H3K4me1, very weak H3K27ac in thymus) | weak enhancers |
| EnhWk6 | weak enhancer blood* (T-cell preferential) and thymus (H3K4me1 and H3K27ac). Very weak enhancers + transcription in others | weak enhancers |
| EnhWk7 | HSC-Bcells weak enhancers (HSC H3K4me1*) | weak enhancers |
| EnhWk8 | 17_EnhW2, 18_EnhAC in ES_derived, ESC, iPSC (K4me1, very weak K27ac). 25_Ques in others. | weak enhancers |
| GapArtf1 | No signal; unmappable - assembly gaps | others |
| GapArtf2 | satellite repeats/artifacts; H3K9me3, DNase I, and some signal from many others | others |
| GapArtf3 | rRNA, satellite repeats; artifacts; High signal most experiments; satellite repeats | others |
| HET1 | H3K9me3. Het in epithelial, IM90, adipose, HSC&B-cell, thymus. LTR repeats Mix of Het and quescient in other. | HET |
| HET2 | H3K9me3+H3K27me3; Quescient: Mesench, blood & T-cell, Brain. PolyRep in Sm.Muscle, muscle. Het in Epithelial, IM90, Myostat | HET |
| HET3 | H3K9me3 weak; LINE repeats | HET |
| HET4 | H3K9me3; LTR/LINE/satellite repeats; Stronger in Adipose, Mesench, Neurosph, ESC, HSC &Bcells | HET |
| HET5 | H3K9me3 strong; LTR repeats | HET |
| HET6 | H3K9me3 weak; LTR and Other class repeats | HET |
| HET7 | H3K9me3 very weak; LTR and Other class repeats | HET |
| HET8 | H3K9me3 and some H3K27me3; LTR, RNA repeats | HET |
| HET9 | H3K9me3 - ESC/iPSC; LTR, Satellite repeats | HET |
| PromF1 | H3K4me1 strongest, all ct; some promoter flank; other marks: H3K4me2, DNase, H2A.Z, weaker in H3K4me3, H3K27ac, H3K9ac, class1 acetylation | promoters |
| PromF2 | H3K4me1, H3K4me2, H3K4me3, DNase, acetylations promoter flank upstream bias | promoters |
| PromF3 | H3K4me2, H3K4me3, H3K4me1(weaker than me3), DNase, acetylations - flanking tss upstream and downstream | promoters |
| PromF4 | H3K4me2, H3K4me3 limited H3K4me1, heavily acetylated - flanking tss downstream bias | promoters |
| PromF5 | flanking promoter; 2_PromU in most cell types; stronger on H3K4me3 | promoters |
| PromF6 | active downstream promoter (3_PromD1, 4_PromD2 all ct); | promoters |
| PromF7 | Prom further downstream (neighborhood enrichment); 4_PromD2 all ct; H3K4me1, H3K4me2, H3K4me3, H3K79me2, H3K9ac, H3K27ac | promoters |
| Quies1 | quescient; H3K9me3 very weak; broad domain; Cell lines; ENCODE2012, Epithelial, IMR90, Myostat | quescient |
| Quies2 | quescient; H3K9me3 weak inIMR90, Epithelial, ENCODE2012, Myostat | quescient |
| Quies3 | quescient (very low non-specific signal) | quescient |
| Quies4 | H3K9me3 very weak; LINE repeats; 25_ques in most ct. 21_Het in ESC-related | quescient |
| Quies5 | quescient (H3K9me3/H3K27me3 very weak) | quescient |
| ReprPC1 | ReprPC (except: PromBiv in ESC); H3K27me3 strong and H3K4me1 weak | polycomb repressed |
| ReprPC2 | polycomb repressed (H3K27me3) | polycomb repressed |
| ReprPC3 | weak polycomb repressed (H3K27me3 weak) | polycomb repressed |
| ReprPC4 | very weak polycomb repressed (H3K27me3 very weak) | polycomb repressed |
| ReprPC5 | polycomb repressed (H3K27me3 in most cell types and some class1 acetylation in ESC and ESC-derived) | polycomb repressed |
| ReprPC6 | 24_ReprPC (H3K27me3) in Brain, Epithelial, muscles, Mesench, Neurosph, Mystat, IM90, Adipose. Others quescient | polycomb repressed |
| ReprPC7 | 17_EnhW: brain, HSC&B-cell, Neurosph, ESC, iPSC, Heart. 24_ReprPC: Epithelial, Mesench, Mystat, IM90, Adipose.H3K27me3 IMR90, Epithelial, Myostat, Mesench with some class 1 acetylations and H3K4me1 | polycomb repressed |
| ReprPC8 | H3K27me3/H3K9me3 weak. Mixed 25_Ques and 24_ReprPC | polycomb repressed |
| ReprPC9 | H3k27me3 in es/ipsc; Weak H3K27me3 in others; 24_ReprPC in all ct | polycomb repressed |
| TSS1 | TSS more acetylated and active; 1_TssA in all cell types | TSS |
| TSS2 | TSS (22_PromP in iPSC) | TSS |
| Tx1 | H3K79me2. Mostly Tx5p, some TxEnhW in Blood & T-cell (Blood_H3K4me1*) | transcription |
| Tx2 | weak H3K79me2, 5_Tx5p | transcription |
| Tx3 | H3K79m2 and H3K79me1, 5_Tx5p, | transcription |
| Tx4 | H3K79me2 and H3K36me3 (weaker). 6_Tx, few 5_Tx5p | transcription |
| Tx5 | H3K36me3; SINE repeats strongest; 7_Tx3p in all most all cell types | transcription |
| Tx6 | H3K36me3 - HSC&B-cell and Mesench preference. 7_Tx3p in blood, mesench, ESC, iPsc, Myostat, adipose, thymus. | transcription |
| Tx7 | H3K36me3 strong, HSC&B-cell and Mesench preference; 7_Tx3p in all cell types | transcription |
| Tx8 | H3K36me3 (weaker); Mix of 7_Tx3p and 8_TxWk | transcription |
| TxEnh1 | H3K79me2 and enhancers Mesench, Myostat, ENCODE, Epithelial | transcribed and enhancer |
| TxEnh2 | H3K79me2 and blood enhancers (Blood_H3K4me1*) | transcribed and enhancer |
| TxEnh3 | H3K79me2 strong, H3K79me1, H4K20me1, H3K36me3, some enhancers. 6_Tx in ESC, ES-deriv and iPSC. 12_TxEnhW in Blood &T-cell, sm. Muscle, myostat and adipose | transcribed and enhancer |
| TxEnh4 | H3K36me3 strong and some enhancers (H3K27ac, H3K4me1); exons; near TES; 11_TxEnh3p all cell types | transcribed and enhancer |
| TxEnh5 | H3K36me3 (weaker). 11_TxEnh3p in most cell types. 7_Tx3p in a few | transcribed and enhancer |
| TxEnh6 | H3K36me3 + enhancers blood preference (H3K4me1, H3K4me3, H3K27ac). 11_TxEnh3p in all cell types | transcribed and enhancer |
| TxEnh7 | H3K79me2 and enhancers; 10_TxEnh5p, 12_TxEnhW in all cell types | transcribed and enhancer |
| TxEnh8 | Transcribed enhancers 3’; enhancers Myostat, IMR90, Mesench, Epithelial | transcribed and enhancer |
| TxEx1 | H3K79me2 and H3K36me3; exon; 6_Tx | exon |
| TxEx2 | H3K36me3 strongest; exons; Tx3p | exon |
| TxEx3 | H3K36me3 strong; exon; Tx3p | exon |
| TxEx4 | TES and some promoter flanking; 9_TxReg; very high avg_gene_exp; H3K36me3, H3K79me2, H3K79me1, H3K27ac, H3K4me1, H3K4me2, H3K9ac | exon |
| TxWk1 | H3K36me3 weak; weak transcription; 8_TxWk | weak transcription |
| TxWk2 | H3K36me3 weak; 8_TxW in all cell types; some acetylations | weak transcription |
| znf1 | H3K36me3+H3K9me3; ZNF genes | znf |
| znf2 | H3K36me3+H3K9me3 strong; ZNF genes (~80 folds) | znf |
[1] H. Vu and J. Ernst, “Universal annotation of the human genome through integration of over a thousand epigenomic datasets,” Genome Biology, vol. 23, no. 1, p. 9, Jan. 2022, doi: 10.1186/s13059-021-02572-z.
4.4 3D Genome Information
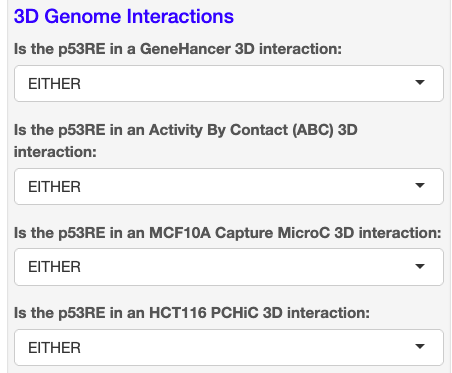
Figure 4.8: Filtering by p53RE location within 3D chromatin loops
The p53motifDB provides p53RE information integrated with four separate 3D chromatin data sets. The concept is to identify p53RE that participate in long-distance chromatin interactions, the type normally found between distal regulatory elements and gene promoters. Although the terminology can differ between assays, generally 3D chromatin data entry contains two genomic locations: a bait and an prey. The bait is the genomic location of interest to which you are hoping to find interactions with distal elements. These can also be called “anchors” or “viewpoints”. This is most evident in promoter capture-style experiments, where the bait/anchor/viewpoint is a promoter region. The concept is to then identify distal elements nearby the promoter in physical, 3D space in the nucleus, as proximity is thought to reflect biochemical function (such as an enhancer element interacting with a promoter to activate transcription).
Consistent with the p53RE-centric data analysis in this database, the p53RE can be found in either the bait or prey region.
As shown in Figure 4.8, the four dropdown boxes allow users to filter by the presence of a p53RE within a bait/prey interaction. Users can select YES if they only want to consider p53RE that are part of such interactions, NO if they would like to examine those with no known 3D interactions, or ANY if this is not a concern for their analysis.
Importantly, users can gain additional information about the bait:prey relationships, including the location of both, cell line information, and other descriptive or quantitative information as described in Chapter 6
The following datasets are provided in the p53motifDB:
TABLE 3
| dataset | citation |
|---|---|
| GeneHancer | S. Fishilevich et al., “GeneHancer: genome-wide integration of enhancers and target genes in GeneCards,” Database, vol. 2017, p. bax028, Jan. 2017, doi: 10.1093/database/bax028. |
| Activity-by-Contact | C. P. Fulco et al., “Activity-by-contact model of enhancer–promoter regulation from thousands of CRISPR perturbations,” Nature Genetics, vol. 51, no. 12, Art. no. 12, Dec. 2019, doi: 10.1038/s41588-019-0538-0. |
| Capture MicroC from MCF10A | This manuscript |
| Promoter Capture HiC from HCT116 | F. Serra et al., “p53 rapidly restructures 3D chromatin organization to trigger a transcriptional response,” Nat Commun, vol. 15, no. 1, p. 2821, Apr. 2024, doi: 10.1038/s41467-024-46666-1. |
4.5 Genome Variation
Users can also use the basic filtering options to select p53RE with known DNA variants from the ClinVar or dbSNP156 databases. We only considered variation within the p53RE itself, as described in the accompanying manuscript.
Using the dropdown menus, users can select whether or not the p53RE has a known variant (YES/NO), or whether sequence variation is not important to the filtering (EITHER). Additional information about genomic variation within the p53RE, including the variant, predicted effects, and other key information, can be obtained by downloading accessory datasets as explained in Chapter 6: Querying Additional Datasets
4.6 Other Genomic Variables
The final set of Basic Filters represent miscellaneous genomic features that may be of interest to users of the p53motifDB. Each filter provides basic functionality, asking users to choose whether or not to filter based on the feature (YES/NO), or whether the feature is not important for their analysis and shouldn’t be considered (ANY). “ANY” is selected by default.
4.6.1 Intergenic or Intragenic?
This filter allows users to select whether their p53RE are located within gene bodies (intragenic) or outside of gene bodies (intergenic). By default, “ANY” is selected which means p53RE are displayed regardless of their location relative to genes. Gene models and locations were taken from the Ensembl v.111 release for hg38 reference genome.
4.6.2 Repetitive Elements
Genomes contain multiple types of repetitive DNA sequences, including simple DNA repeats, microsatellites, and viral and transposable-element derived sources. Multiple publications have noted that p53RE can be found within these types of repetitive elements, and that p53 can regulate transcription and other genomic activities via binding to such repetitive elements.
We surveyed p53RE locations within repetitive genomic elements using the RepeatMasker dataset hosted by the UCSC Genome Browser.
Additional information about the repetitive elements, such as the type of element, can be obtained by downloading accessory data sets as explained in Chapter 6: Querying Additional Datasets
4.6.3 ENCODE BlackList
Genomic approaches, like ChIP-seq, require alignment to a reference genome. The Blacklist has been compiled containing regions of the human hg38 reference genome that are recurrently identified across multiple assays and for multiple antibodies/targets, suggesting anomalies in genome assembly. This information, along with the methods and rationale for selection of blacklists, can be found in a recent publication from the Boyle and Kundaje labs [1]. Thus, these regions are traditionally filtered from downstream analysis. Users can filter their p53RE by their location within (YES) or outside of (NO) blacklist regions. If these regions are not important for downstream analysis, users can ignore this filtering step and select ANY, which is the default setting.
We strongly advise that users select NO on the Blacklist filter and only consider p53RE for which genomic assay data can be reliably mapped and reported (not in the blacklist regions).
The current ENCODE Blacklist for hg38 can found at the Boyle Lab GitHub Page.
[1] H. M. Amemiya, A. Kundaje, and A. P. Boyle, “The ENCODE Blacklist: Identification of Problematic Regions of the Genome,” Sci Rep, vol. 9, no. 1, p. 9354, Jun. 2019, doi: 10.1038/s41598-019-45839-z.
4.6.4 Potential CG Methylation Sites
Recent evidence suggests that DNA methylation in the CG context can influence p53 interactions with the genome in interesting ways. The influence of CG methylation depends on the position of the CG within the p53RE. Users can select whether the p53RE contains a potential site of CG methylation. Selecting YES does not mean the p53RE contains experimentally-determined DNA methylation, rather that a CG is present as a potential target of methylation.
[1] J. F. Kribelbauer et al., “Quantitative Analysis of the DNA Methylation Sensitivity of Transcription Factor Complexes,” Cell Reports, vol. 19, no. 11, pp. 2383–2395, Jun. 2017, doi: 10.1016/j.celrep.2017.05.069.